· 11 min read
Shyam Sreevalsan

blog

As systems increasingly shift towards distributed architectures to deliver application services, the roles of monitoring and observability have never been more crucial. Monitoring delivers the situational awareness you need to detect issues, while observability goes a step further, offering the analytical depth to understand the root cause of those issues.

Understanding the nuanced differences between monitoring and observability is crucial for anyone responsible for system health and performance. In dissecting these methodologies, we'll explore their unique strengths, dive into practical applications, and illuminate how to strategically employ each to enhance operational outcomes.

To set the stage, consider a real-world scenario that many of us have encountered: It's 3 a.m., and you get an alert that a critical service is down. Traditional monitoring tools may tell you what's wrong, but they won't necessarily tell you why it's happening leaving that part up to you. With observability, the tool enables you to explore your system's internal state and uncover the root cause in a faster and easier manner.

The Conceptual Framework

Monitoring has its roots in the early days of computing, dating back to mainframes and the first networked systems. The primary objective was straightforward: keep the system up and running. Threshold-based alerts and basic metrics like CPU usage, memory consumption, and disk I/O were the mainstay. These metrics provided a snapshot but often lacked the context needed for debugging complex issues.

Observability, on the other hand, is a relatively new paradigm, inspired by control theory and complex systems theory. It came to prominence with the rise of microservices, container orchestration, and cloud-native technologies. Unlike monitoring, which focuses on known problems, observability is designed to help you understand unknown issues. The concept gained traction as systems became too complex to understand merely through predefined metrics or logs.

Monitoring: The Watchtower

Monitoring is about gathering data to answer known questions. These questions usually take the form of metrics, alerts, and logs configured ahead of time. In essence, monitoring systems act as a watchtower, constantly scanning for pre-defined conditions and alerting you when something goes awry. The approach is inherently reactive; you set up alerts based on what you think will go wrong and wait.

For instance, you might set an alert for when CPU usage exceeds 90% for a prolonged period. While this gives you valuable information, it doesn't offer insights into why this event is occurring. Was there a sudden spike in user traffic, or is there an inefficient code loop causing the CPU to max out?

Observability: The Explorer

Observability is a more dynamic concept, focusing on the ability to ask arbitrary questions about your system, especially questions you didn't know you needed to ask. Think of observability as an explorer equipped with a map, compass, and tools that allow you to discover and navigate unknown territories of your system. With observability, you can dig deeper into high-cardinality data, enabling you to explore the "why" behind the issues.

For example, you may notice that latency has increased for a particular service. Observability tools will allow you to drill down into granular data, like traces or event logs, to identify the root cause, whether it be an inefficient database query, network issues, or something else entirely.

Key Differences between Monitoring & Observability

Data

Monitoring and observability rely heavily on these three fundamental data types: metrics, logs and traces. However the approach taken in collecting, examining and utilizing this data can differ significantly.

Both monitoring and observability rely on data, but the kinds of data they use and how they use it can differ substantially.

Metrics in Monitoring vs Observability

Metrics serve as the backbone of both monitoring and observability, providing numerical data that is collected over time. However, the granularity, flexibility, and usage of these metrics differ substantially between the two paradigms.

Monitoring: Predefined and Aggregate Metrics

In a monitoring setup, metrics are often predefined and tend to be aggregate values, such as averages or sums calculated over a specific time window. These metrics are designed to trigger alerts based on known thresholds. For example, you might track the average CPU usage over a five-minute window and set an alert if it exceeds 90%. While this approach is effective for catching known issues, it lacks the context needed to understand why a problem is occurring.

Observability: High-Fidelity, High-Granularity and Context-Rich Metrics

Observability platforms go beyond merely collecting metrics; they focus on high-granularity, real-time metrics that can be dissected and queried in various ways. Here, you're not limited to predefined aggregate values. You can explore metrics like request latency at the 99th percentile over a one-second interval or look at the distribution of database query times for a particular set of conditions. This depth allows for a more nuanced understanding of system behavior, enabling you to pinpoint issues down to their root cause.

A critical aspect that is often overlooked is the need for real-time, high-fidelity metrics, which are metrics sampled at very high frequencies, often per second. In a system where millions of transactions are happening every minute, a five-minute average could hide critical spikes that may indicate system failure or degradation. Observability platforms are generally better suited to provide this level of granularity than traditional monitoring tools.

Logs: Event-Driven in Monitoring vs Queryable in Observability

Logs provide a detailed account of events and are fundamental to both monitoring and observability. However, the treatment differs.

Monitoring: Event-Driven Logs

In monitoring systems, logs are often used for event-driven alerting. For instance, a log entry indicating an elevated permissions login action might trigger an alert for potential security concerns. These logs are essential but are typically consulted only when an issue has already been flagged by the monitoring system.

Observability: Queryable Logs

In observability platforms, logs are not just passive records; they are queryable data points that can be integrated with metrics and traces for a fuller picture of system behavior. You can dynamically query logs to investigate anomalies in real-time, correlating them with other high-cardinality data to understand the 'why' behind an issue.

Proactive vs Reactive

The second key difference lies in how these approaches are generally used to interact with the system.

Monitoring: Set Alerts and React

Monitoring is generally reactive. You set up alerts for known issues, and when those alerts go off, you react. It’s like having a fire alarm; it will notify you when there’s a fire, but it won’t tell you how the fire started, or how to prevent it in the future.

Observability: Continuous Exploration

Observability, by contrast, is more proactive. With an observability platform, you’re not just waiting for things to break. You’re continually exploring your data to understand how your system behaves under different conditions. This allows for more preventive measures and enables engineers to understand the system’s behavior deeply.

Opinionated Dashboards and Charts

Navigating the sprawling landscape of system data can be a daunting task, particularly as systems scale and evolve. Both monitoring and observability tools offer dashboards and charts as a solution to this challenge, but the philosophy and functionality behind them can differ significantly.

Monitoring: Pre-Built and Prescriptive Dashboards

In the realm of monitoring, dashboards are often pre-built and prescriptive, designed to highlight key performance indicators (KPIs) and metrics that are generally considered important for the majority of use-cases. For instance, a pre-configured dashboard for a database might focus on query performance, CPU usage, and memory consumption. These dashboards serve as a quick way to gauge the health of specific components within your system.

  • Quick Setup: Pre-built dashboards require little to no configuration, making them quick to deploy.
  • Best Practices: These dashboards are often designed based on industry best practices, providing a tried-and-true set of metrics that most organizations should monitor.
  • Lack of Flexibility: Pre-built dashboards are not always tailored to your specific needs and might lack the ability to perform ad-hoc queries or deep dives.
  • Surface-Level Insights: While useful for a quick status check, these dashboards may not provide the contextual data needed to understand the root cause of an issue.
Observability: Customizable and Exploratory Dashboards

Contrastingly, observability platforms often allow for much greater customization and flexibility in dashboard creation. You can build your own dashboards that focus on the metrics most relevant to your specific application or business needs. Moreover, you can create ad-hoc queries to explore your data in real-time.

  • Deep Insights: Custom dashboards allow you to drill down into high-cardinality data, providing nuanced insights that can lead to effective problem-solving.
  • Contextual Understanding: Because you can tailor your dashboard to include a wide range of metrics, logs, and traces, you get a more contextual view of system behavior.
  • Complexity: The flexibility comes at the cost of complexity. Building custom dashboards often requires a deep understanding of the data model and query language of the observability platform.
  • Time-Consuming: Crafting a dashboard that provides valuable insights can be a time-consuming process, especially if you're starting from scratch.

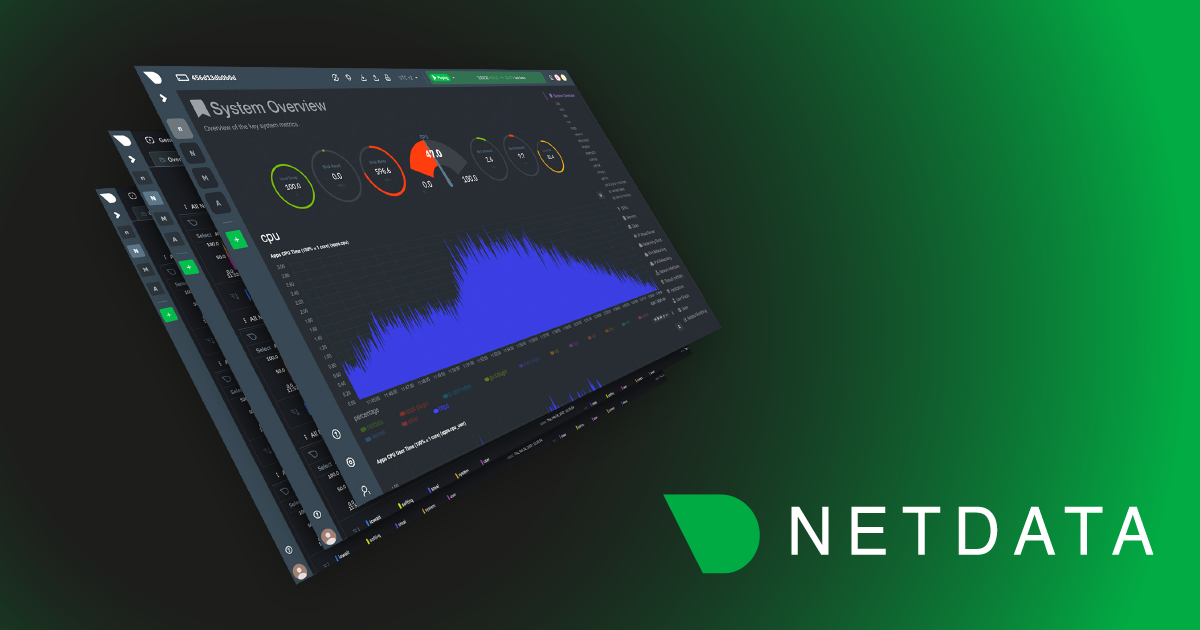
Netdata aims to deliver the best of both worlds by giving you out-of-the-box opinionated, powerful, flexible, customizable dashboards for every single metric.

Recording 2023-10-24 135447

Real-World Applications: Monitoring vs Observability

Understanding the key differences between monitoring and observability is pivotal, but these concepts are best illustrated through real-world use cases. Below, we delve into some sample scenarios where each approach excels, offering insights into their practical applications.

Network Performance

Monitoring tools are incredibly effective for tracking network performance metrics like latency, packet loss, and throughput. These metrics are often predefined, allowing system administrators to quickly identify issues affecting network reliability. For example, if a VPN connection experiences high packet loss, monitoring tools can trigger an alert, prompting immediate action.

Debugging Microservices

In a microservices architecture, services are loosely coupled but have to work in harmony. When latency spikes in one service, it can be a herculean task to pinpoint the issue. This is where observability shines. By leveraging high-cardinality data and dynamic queries, engineers can dissect interactions between services at a granular level, identifying bottlenecks or failures that are not immediately obvious.

Case Study: Transitioning from Monitoring to Observability

Consider a real-world example of a SaaS company that initially relied solely on monitoring tools. As their application grew in complexity and customer base, they started noticing unexplained latency issues affecting their API. Traditional monitoring tools could indicate that latency had increased but couldn't offer insights into why it was happening.

The company then transitioned to an observability platform, enabling them to drill down into granular metrics and traces. They discovered that the latency was tied to a specific database query that only became problematic under certain conditions. Using observability, they could identify the issue, fix the inefficient query, and substantially improve their API response times. This transition not only solved their immediate problem but equipped them with the tools to proactively identify and address issues in the future.

Synergy and Evolution: The Future of Monitoring and Observability

The choice between monitoring and observability isn't binary; often, they can complement each other. Monitoring provides the guardrails that keep your system running smoothly, while observability gives you the tools to understand your system deeply, especially as it grows in complexity.

As we continue to push the boundaries of what's possible in software development and system architecture, both monitoring and observability paradigms are evolving to meet new challenges and leverage emerging technologies. The sheer volume of data generated by modern systems is often too vast for humans to analyze in real-time. AI and machine learning algorithms can sift through this sea of information to detect anomalies and even predict issues before they occur. For example, machine learning models can be trained to recognize the signs of an impending system failure, such as subtle but unusual patterns in request latency or CPU utilization, allowing for preemptive action.

Monitoring and observability serve distinct but complementary roles in the management of modern software systems. Monitoring provides a reactive approach to known issues, offering immediate alerts for predefined conditions. It excels in areas like network performance and infrastructure health, acting as a first line of defense against system failures. Observability, on the other hand, allows for a more proactive and exploratory interaction with your system. It shines in complex, dynamic environments, enabling teams to understand the 'why' behind system behavior, particularly in microservices architectures and real-world debugging scenarios.

Netdata: Real-Time Metrics Meet Deep Insights

Netdata offers capabilities that span both monitoring and observability. It delivers real-time, per-second metrics, making it a powerful resource for those in need of high-fidelity data. Netdata provides out-of-the-box dashboards for every single metric as well as the capability to build custom dashboards, bridging the gap between static monitoring views and the dynamic, exploratory nature of observability. Whether you're looking to simply keep an eye on key performance indicators or need to dig deep into system behavior, Netdata offers a balanced, versatile solution.

Check out Netdata's public demo space or sign up today for free, if you haven't already.

Happy Troubleshooting!
image

· 3 min read
Shyam Sreevalsan

systemd - netdata

Today, we released our systemd journal plugin for Netdata, allowing you to explore, view, search, filter and analyze systemd journal logs.

Like most things about Netdata, this is a zero-configuration plugin. You don’t have to do anything apart from installing Netdata on your systems.This is key design direction for Netdata, since we want Netdata to be able to help even if you install it mid-crisis, while you have an incident at hand.

· 3 min read
Costa Tsaousis

image

“Why bother with it? I let it run in the background and focus on more important DevOps work.” a random DevOps Engineer at Reddit r/devops

In an era where technology is evolving at breakneck speeds, it's easy to overlook the tools that are right under our noses. One such underutilized powerhouse is the systemd journal. For many, it's a mere tool to check the status of systemd service units or to tail the most recent events (journalctl -f). Others who do mainly container work, ignore even its existence.

What is the purpose of systemd-journal?

However, the systemd journal includes very important information. Kernel errors, application crashes, out of memory process kills, storage related anomalies, crucial security intel like ssh or sudo attempts and security audit logs, connection / disconnection errors, network related problems, and a lot more. The system journal is brimming with data that can offer deep insights into the health and security of our systems and still many professional system and devops engineers tend to ignore it.

· 11 min read
Satyadeep Ashwathnarayana

netdata-prometheus-grafana-stack

In this blog, we will walk you through the basics of getting Netdata, Prometheus and Grafana all working together and monitoring your application servers. This article will be using docker on your local workstation. We will be working with docker in an ad-hoc way, launching containers that run /bin/bash and attaching a TTY to them. We use docker here in a purely academic fashion and do not condone running Netdata in a container. We pick this method so individuals without cloud accounts or access to VMs can try this out and for it's speed of deployment.

· 7 min read
Satyadeep Ashwathnarayana

netdata-prometheus-grafana-stack

Netdata reads /proc/<pid>/stat for all processes, once per second and extracts utime and stime (user and system cpu utilization), much like all the console tools do.

But it also extracts cutime and cstime that account the user and system time of the exit children of each process. By keeping a map in memory of the whole process tree, it is capable of assigning the right time to every process, taking into account all its exited children.

It is tricky, since a process may be running for 1 hour and once it exits, its parent should not receive the whole 1 hour of cpu time in just 1 second - you have to subtract the cpu time that has been reported for it prior to this iteration.

It is even trickier, because walking through the entire process tree takes some time itself. So, if you sum the CPU utilization of all processes, you might have more CPU time than the reported total cpu time of the system. Netdata solves this, by adapting the per process cpu utilization to the total of the system.

· 9 min read
Satyadeep Ashwathnarayana

netdata-qos-classes

Netdata monitors tc QoS classes for all interfaces.

If you also use FireQOS it will collect interface and class names.

There is a shell helper for this (all parsing is done by the plugin in C code - this shell script is just a configuration for the command to run to get tc output).

The source of the tc plugin is here. It is somewhat complex, because a state machine was needed to keep track of all the tc classes, including the pseudo classes tc dynamically creates.

You can see a live demo here.

· 4 min read
Andrew Maguire

node-anomaly-rate-alert

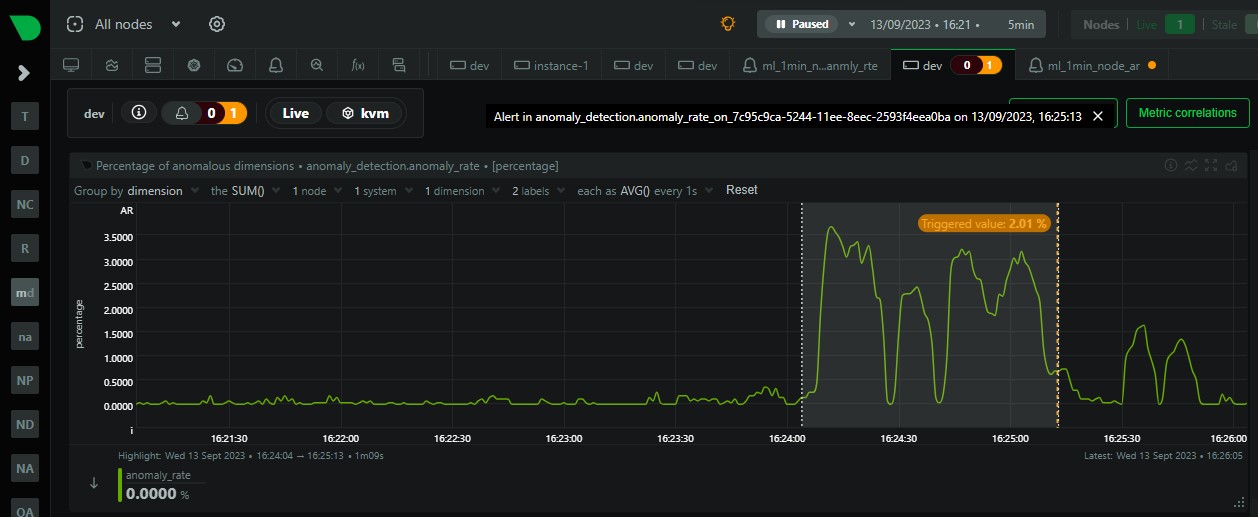
Over the last few years we have slowly and methodically been building out the ML based capabilities of the Netdata agent, dogfooding and iterating as we go. To date, these features have mostly been somewhat reactive and tools to aid once you are already troubleshooting.

Now we feel we are ready to take a first gentle step into some more proactive use cases, starting with a simple node level anomaly rate alert.

· 3 min read
Andrew Maguire

netdata-ansible

We are always trying to lower the barrier to entry when it comes to monitoring and observability and one place we have consistently witnessed some pain from users is around adopting and approaching configuration management tools and practices as your infrastructure grows and becomes more complex.

To that end, we have begun recently publishing our own little example ansible project used to maintain and manage the servers used in our public Machine Learning Demo room.

This post introduces this project as a somewhat simple example of using Ansible with Netdata. Read on to learn more, but more importantly feel free to explore the repo and see how it all hangs together.

· 14 min read
Satyadeep Ashwathnarayana

stacked-netdata

What are they and why do we need them?

A “Parent” is a Netdata Agent, like the ones we install on all our systems, but is configured as a central node that receives, stores and processes metrics data from other Netdata “Child” nodes in our infrastructure.

Netdata Parents are flexible. You can have one big active-active cluster of Netdata Parents, or you can spread a lot of independent Parents across the infrastructure.

This “distributed still centralized” setup provides a lot of benefits. Let’s go through them one by one in this blog post.

· 11 min read

In this blog post, we will explore the importance of scalability, automation, and AI in the evolving landscape of infrastructure monitoring. We will examine how Netdata's innovative solution aligns with these emerging trends, and how it can empower organizations to effectively manage their modern IT infrastructure.

· 11 min read
Satyadeep Ashwathnarayana

stacked-netdata

In today's fast-paced digital landscape, 24-hour operations centers play a crucial role in managing and monitoring large-scale infrastructures. These centers must be equipped with an effective monitoring solution that addresses their unique needs, enabling them to respond quickly to incidents and maintain optimal system performance. Netdata, a comprehensive monitoring solution, has been designed to meet these critical requirements with its advanced capabilities and recent enhancements.

In this article, we will explore how Netdata's powerful features can transform the way 24-hour operations centers monitor and manage their complex environments, leading to improved incident detection, faster troubleshooting, and better overall system performance.

· 7 min read

The advent of multi-cloud and hybrid-cloud architectures has created new opportunities for organizations to leverage best-in-class features from various cloud service providers. However, these complex environments present their own unique challenges, especially when it comes to monitoring and managing performance.

· 13 min read
Satyadeep Ashwathnarayana

stacked-netdata

Netdata provides a comprehensive set of charts that can help you understand the workload, performance, utilization, saturation, latency, responsiveness, and maintenance activities of your disks. In this blog we will focus on monitoring disks as block devices, not as filesystems or mount points.

· 12 min read
Satyadeep Ashwathnarayana

stacked-netdata

Memory-intensive applications can benefit from improved performance by using huge pages, as they can reduce TLB pressure and memory fragmentation, and lower the memory management overhead overall. Developers should consider using HugeTLBfs in their mmap() and shmget() calls to take advantage of huge pages.

Transparent Huge Pages (THP) is a Linux kernel feature that provides some of the benefits of huge pages without requiring any development effort. However, THP can cause latency in many applications. Although kernel developers are actively working to address these issues, many system administrators prefer to disable THP altogether.

Netdata can assist in determining whether THP is helpful or harmful to your applications, which can guide your decision regarding its use.

· 9 min read
Satyadeep Ashwathnarayana

stacked-netdata

The mem.kernel chart in Netdata provides insight into the memory usage of various kernel subsystems and mechanisms. By understanding these dimensions and their technical details, you can monitor your system's kernel memory usage and identify potential issues or inefficiencies. Monitoring these dimensions can help you ensure that your system is running efficiently and provide valuable insights into the performance of your kernel and memory subsystem.

mem-kernel

· 11 min read
Satyadeep Ashwathnarayana

stacked-netdata

Entropy is a measure of the randomness or unpredictability of data. In the context of cryptography, entropy is used to generate random numbers or keys that are essential for secure communication and encryption. Without a good source of entropy, cryptographic protocols can become vulnerable to attacks that exploit the predictability of the generated keys.

· 4 min read
Satyadeep Ashwathnarayana

stacked-netdata

Swap memory, also known as virtual memory, is a space on a hard disk that is used to supplement the physical memory (RAM) of a computer. The swap space is used when the system runs out of physical memory, and it moves less frequently accessed data from RAM to the hard disk, freeing up space in RAM for more frequently accessed data. But should swap memory be enabled on production systems and cloud-provided virtual machines (VMs)? Let's explore the pros and cons.

· 5 min read
Satyadeep Ashwathnarayana

stacked-netdata

Context switching is the process of switching the CPU from one process, task or thread to another. In a multitasking operating system, such as Linux, the CPU has to switch between multiple processes or threads in order to keep the system running smoothly. This is necessary because each CPU core without hyperthreading can only execute one process or thread at a time. If there are many processes or threads running simultaneously, and very few CPU cores available to handle them, the system is forced to make more context switches to balance the CPU resources among them.

Context switching is an essential function of any multitasking operating system, but it also comes at a cost. The whole process is computationally intensive, and the more context switches that occur, the slower the system becomes. This is because each context switch involves saving the current state of the CPU, loading the state of the new process or thread, and then resuming execution of the new process or thread. This takes time and consumes CPU resources, which can slow down the system.

The impact of context switching on system performance can be significant, especially in systems with many processes or threads running simultaneously.

· 14 min read
Satyadeep Ashwathnarayana

stacked-netdata

As a system administrator, understanding how your Linux system's CPU is being utilized is crucial for identifying bottlenecks and optimizing performance. In this blog post, we'll dive deep into the world of Linux CPU consumption, load, and pressure, and discuss how to use these metrics effectively to identify issues and improve your system's performance.

· 3 min read
Shyam Sreevalsan

img

Hello, fellow data enthusiasts and Google Colab aficionados! Today, we're going to explore how to monitor your Google Colab instances using Netdata. Colab is a fantastic platform for running Notebooks, developing ML models, and other data science and analytics tasks. But have you ever wondered how your Colab instance is performing under the hood? That's where Netdata comes into play!
· 6 min read
Austin S. Hemmelgarn

At Netdata, we’re committed to trying to make Netdata work as well as possible for our users. Sometimes though, that means changing things in ways that aren’t exactly seamless. Such a change is coming soon for users of our native DEB and RPM packages, and this blog post will explain what’s happening, why we’re doing it, and what it means for our users.

· 4 min read
Andrew Maguire

img

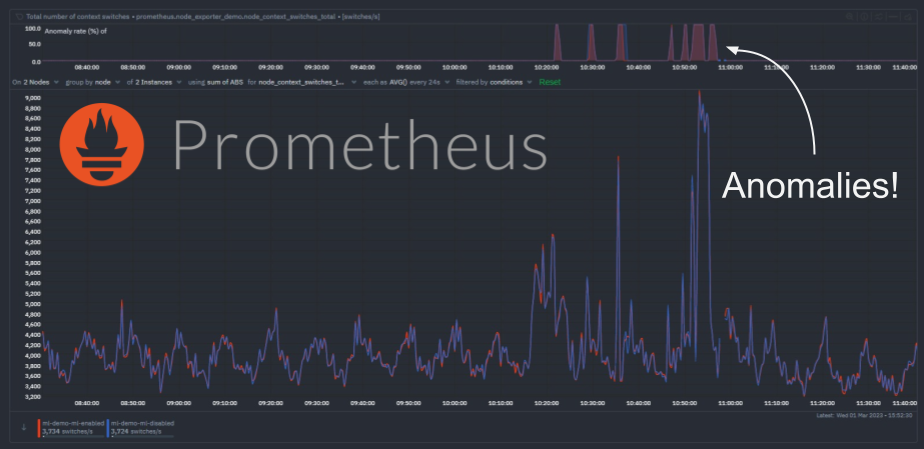
We have recently extended the native machine learning (ML) based anomaly detection capabilities of Netdata to support all metrics, regardless on their collection frequency (update every).

Previously only metrics collected every second were supported, but now Netdata can run anomaly detection out of the box with zero config on metrics with any collection frequency.

This post will illustrate an example of what this means using Prometheus metrics (via the Netdata Prometheus collector) since they typically have a default collection frequency of 10 seconds.

· 9 min read
Andrew Maguire

img

We recently got this great feedback from a dear user in our Discord:

I would really like to use Netdata to monitor custom internal metrics that come from SQL, not a fan of having 10 diff systems doing essentially the same thing as is, Netdata is pretty much all there in that regard, just needs a few extra features.

This is great and exactly what we want, a clear problem or improvement we could make to help make that users monitoring life a little easier.

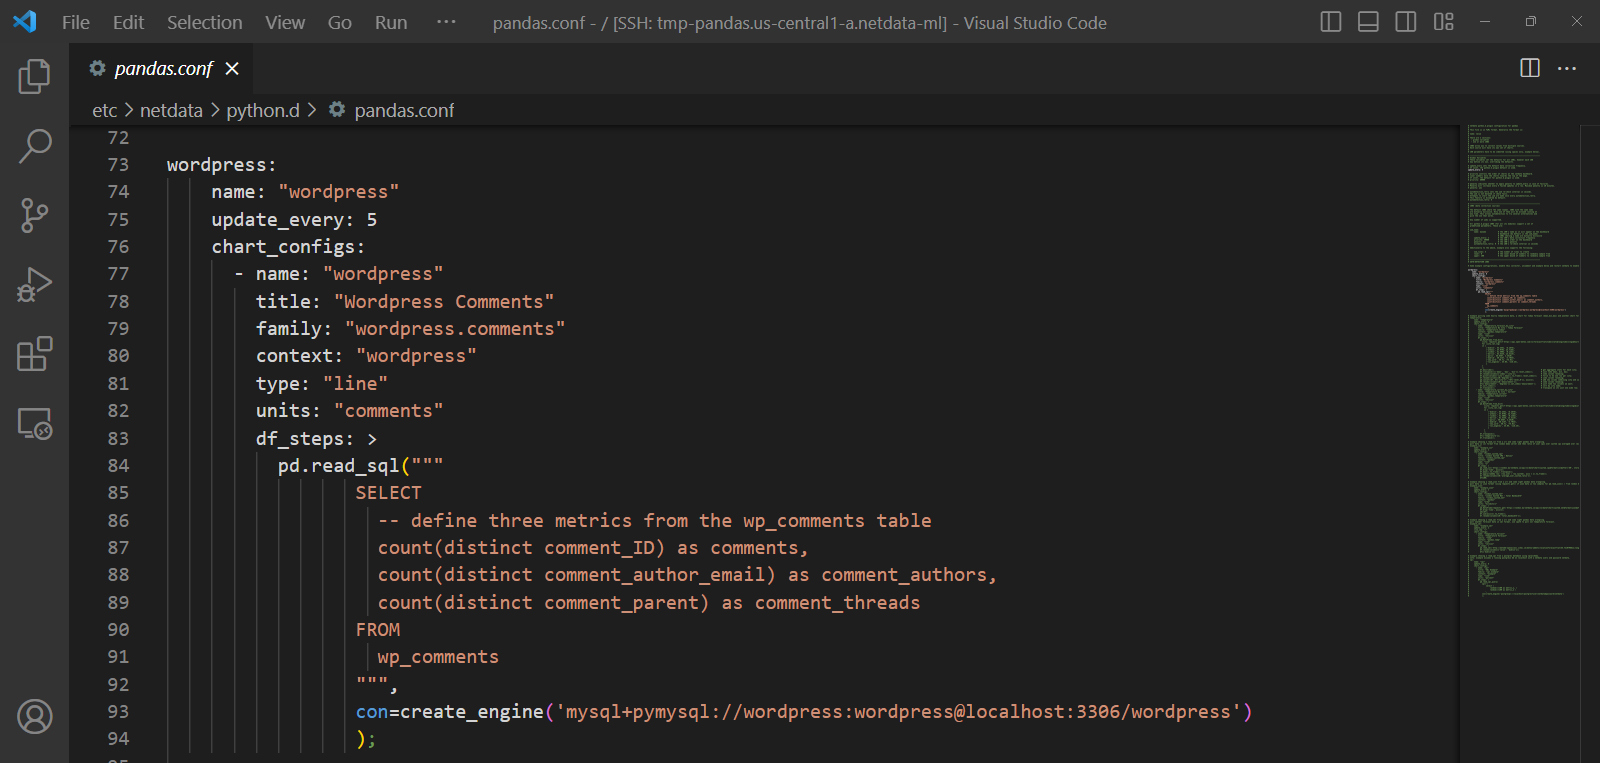
This is also where the beauty of open source comes in and being able to build on the shoulders of giants - adding such a feature turned out to be pretty easy by just extending our existing Pandas collector to support SQL queries leveraging its read_sql() capabilities.

Here is the PR that was merged a few days later.

This blog post will cover an example of using the Pandas collector to monitor some custom SQL metrics from a WordPress MySQL database.

· 9 min read
Andrew Maguire

extending-anomaly-detection-training-window

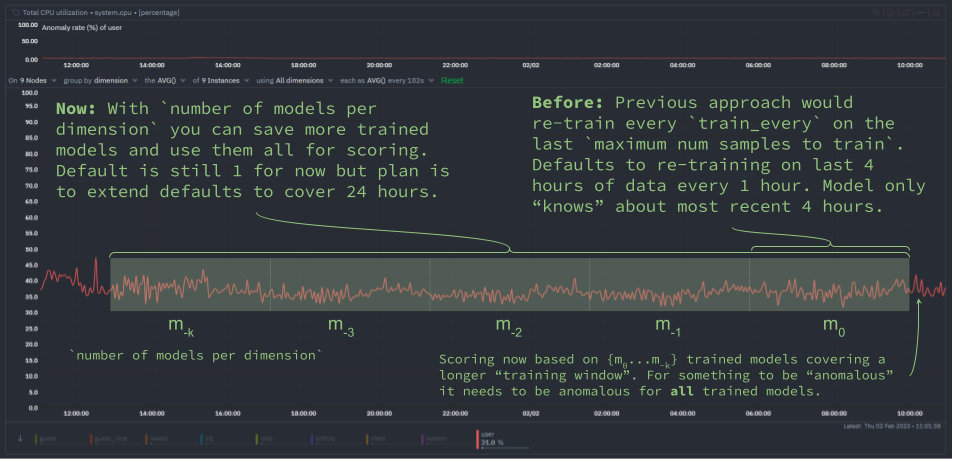
We have been busy at work under the hood of the Netdata agent to introduce new capabilities that let you extend the "training window" used by Netdata's native anomaly detection capabilities.

This blog post will discuss one of these improvements to help you reduce "false positives" by essentially extending the training window by using the new (beautifully named) number of models per dimension configuration parameter.

· 38 min read

Another release of the Netdata Monitoring solution is here!

We focused on these key areas:

Infinite scalability of the Netdata Ecosystem

Default Database Tiering, offering months of data retention for typical Netdata Agent installations with default settings and years of data retention for dedicated Netdata Parents.

Overview Dashboards at Netdata Cloud got a ton of improvements to allow slicing and dicing of data directly on the UI and overcome the limitations of the web technology when thousands of charts are presented on one page.

Integration with Grafana for custom dashboards, using Netdata Cloud as an infrastructure-wide time-series data source for metrics

PostgreSQL monitoring completely rewritten offering state of the art monitoring of the database performance and health, even at the table and index level.

· 5 min read
Satyadeep Ashwathnarayana

Web servers are among the most important components in modern IT infrastructures. They host the websites, web services, and web applications that we use on a daily basis. Social networking, media streaming, software as a service (SaaS), and other activities wouldn’t be possible without the use of web servers. And with the advent of cloud computing and the movement of more services online, web servers and their monitoring are only becoming more important. Given the extensive usage of Web servers, Sysadmins and SREs should monitor web servers as a key aspect for performance.

logo

· 3 min read
Chris Akritidis

The life of a sysadmin or SRE is often difficult, but occasionally very simple things can make a huge difference. Basic monitoring of your systemd services is one of those simple things, which we sometimes overlook. The simplest question one would want to know is if the thing that’s supposed to be running is actually running at all. If you use systemd services, you can guarantee an answer to that question within minutes using Netdata.

· 5 min read
Chris Akritidis

The HTTP protocol has become the de facto standard application layer protocol of the internet. From publicly available web sites and APIs to “inter-process” communications in REST based microservice architectures or large Service Oriented Architectures based on SOAP, you find HTTP being used again and again, due to its simplicity and our familiarity with it. How many protocols can you name that have memes for their status codes? Of course, such a popular protocol has endless pages written about how to properly monitor the services that rely on it, with many options specific to every use case.

· 3 min read
Satyadeep Ashwathnarayana

It is sometimes easy to get lost in the mountain of metrics and infinite number of dimensions when working with an infrastructure monitoring tool. Being able to filter metrics by label and visualize only what is relevant to the current scope of monitoring &troubleshooting, becomes absolutely crucial to the success of SREs, Sysadmins and DevOps professionals.